*
This file documents the 1.20 release of the motion analysis tool called bisce (July 2000).
The bisce package (pr. "bee-sheh") is an image tracking tool developed by Alessandro Rubini (rubini@linux.it) and others. It has been sponsored by the Dept. of Human Physiology, Univ. of Pavia, Italy.
Bisce is a motion analysis tool, originally used to track filaments, whence the name (bisce is the Italian name for snakes). It is implemented as a few separate building blocks and stacking on a few external packages: the pacco image processing library and the pxc frame grabber driver (for the ImageNation pxc200 frame grabber).
While the package doesn't really depend on the specific device driver being used, I designed the acquisition engine of the pxc driver with an eye towards bisce. It should be possible, though, to set up other acquisition engines to produce a bisce-friendly data set.
The package is sponsored by Istituto di Fisiologia Umana in Pavia, Italy, and has been written mainly by Alessandro Rubini, with parts by Massimiliano Pini and Marco Pantaleoni, and is released as free software according to the GNU GPL.
The package is made up of the following components:
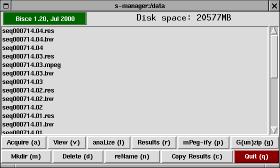
S-manager is a simple file-manager designed to be the entry point for image tracking. If starts in the current directory, unless the environment variable SMANAGER_DATA exists and is a valid directory (in this case the program starts from that directory).
The window is made up of a top bar, a list of files (with scrollbar), and two rows of buttons.
The top bar in s-manager shows the program's version and how much free disk space is available in the current directory. The disk space information (and the file listing) is automatically updated every two seconds. If you click on the version string, a copy of tkinfo is spawned to show this very documentation.
The file list is not comprehensive, it only shows directories, compressed files and bisce-related items. Those items are physical directories on disk, but their content is laid out in a known way and they can be used by other parts of the package (s-viewer and s-results). Double-clicking on list items invokes one of the actions listed below, the specific action depends on the actual item being double-clicked.
S-manager offers the following buttons, each of them can be invoked by typing the associated letter, shown as uppercase in the button name:
Acquire
View
anaLize
Results
mPeg-ify
G(un)zip
Mkdir
Delete
reName
Copy Results
Quit
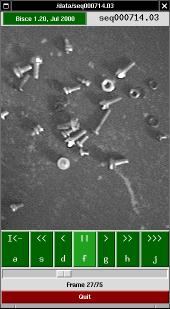
The role of s-viewer is that of showing a sequence of images, usually the results of an acquisition performed by pxc_xgrab.
The window is made up of a top bar, the current image, a row of buttons and a scale showing the position of the current image in the sequence.
The top bar in s-viewer shows the program's version and the name of the image sequence being displayed. If you click on the version string, a copy of tkinfo is spawned to show this very documentation.
The image window is a full-size copy of the current image frame.
The buttons are used to move within the image sequence. Each button can be either clicked with the mouse or invoked by pressing the associated key. The keys chosen to act on the buttons are those in the middle row of the keyboard: a, s, d, f, g, h, j.
I<<
<<
<
||
>
>>
>>>
By acting with the mouse on the horizontal scale, the user can also browse the sequence at will.
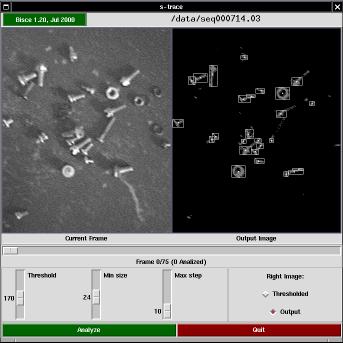
The s-trace program is the graphic front-end to the actual tracking activity (which is partly performed by the graphic program itself, and partly by the s-follow tool.
The window is made up of a top bar, two views of the current frame, a slider showing the current position within the sequence, and a few controls for configurable parameters.
The top bar in s-trace shows the program's version and the name of the image sequence being displayed. If you click on the version string, a copy of tkinfo is spawned to show this very documentation.
The program performs two operations on each image (before passing data down to s-follow): thresholding and cell isolation. The two views of the current frame are the original (acquired) image and a processed image, either the thresholded one or the output image (after cell isolation).
The control knobs are used to select the threshold value (used in the threshold pass), the minimum size of a cell (used to discard invalid light spots in the isolation phase) and the maximum distance (in pixels) that a cell is expected to move between consecutive frames (this parameter is passed to s-follow. Acting on the first two knobs affects the images being displayed, and by using the horizontal slider you can check the effect of parameter setting throughout the acquired sequence.
By pressing the "Analyze" button, actual analysis is fired.
The algorithm used to track cell movement has been split in several passes.
The first step is thresholding the input image, in order to reduce data to a bitmap (a black and white image). The threshold level is an integer number in the range 50-250 and is assigned by the user interface.
Next, the thresholded image is scanned in order to identify white areas. Each individual blob accepted or rejected according to the number of pixels is encloses. If the blob is smaller than the selected minimum it is discarded. Selection of the minimum cell size is done in the user interface (s-trace); the user can immediately see the effects of this thresholding and adapt the minimum size to the specific acquisition data.
The "output image" that results from these steps is saved in a "black and white" directory; the image shows the thresholded input image as well as the bounding box and the center of white areas that are big enough. The "black and white" directory is called like the acquisition directory, with a trailing .bw appended (for example, if the acquisition directory is called "cells-jan25.001" the black and white sequence will be called "cells-jan25.001.bw".
What is used in tracking image movement from one frame to the next is the bounding box of each white area, defined by the smallest and biggest X and Y coordinates of pixels in the area. The list of all the areas detected in each frame is passed as input to s-follow, which is in charge of the actual tracking.
When the s-follow program, it is arranged to save all output data in a directory called like the acquisition directory, with a trailing ".res" added to the name (in the above example, the results will live in "cells-jan25.001.res"). The files in the results directory can then be used by s-results.
The exact operations performed by s-follow and the format of the output files are described in its own documentation.
The s-follow program is a command-line drive tool to filter image data from stdin to stdout. It is usually called by s-trace in order to perform actual image tracking, but it might also be used as a stand-alone tool. The description assumes the program is invoked by s-trace.
Input data for the program is a list of rectangular regions associated to each frame; output data is a list of paths.
Any time a new frame has been completely read, the program scans the list of active paths (i.e., paths that include areas in the last frame, that are therefore likely to continue into the current frame) trying to find a match for each of them.
For each active path, the program finds the area in the new frame that matches best the expected position of the cell in the path (the expected position is the sum of last position and the last calculated speed). Each area in the new frame can only be associated to one path (if the best match for a given path is already taken, the best-but-one will be considered). The best match must in any case follow within a user-defined maximum (expressed in pixels), which is passed as a command-line argument to s-follow, and is usually specified as "Max Step" within s-trace.
If a match is found, the length of the cell is calculated. Since s-follow uses only the bounding-box of the cell, the length is calculated as the length of the intersection of the bounding-box and a line oriented like the cell being tracked (e.g., a cell with a square bounding-box of 10x10 pixels moving towards N-E will have a calculated length of 14.4 pixels.).
Image areas in the new frame that cannot be matched to existing paths are recorded in the list of active paths, because the can be the starting point of a new path.
When every frame has been processed, everything that s-follow identified as a path is printed to stdout, and usually gets saved to a file called res.tmp, in the results directory. The file is then sorted and save to a file called results, which is what is considered the relevant information.
s-follow's output is laid out by lines, where each line identifies a path. Each line includes the following information (used by s-results):
The s-follow program can optionally produce much more verbose information. While this feature has been initially implementing for debugging/verification purposes, later implementations of s-results use all of the available information (in particular, they need to know the exact position of the cell in each frame). Therefore, the "temporary" debug file is now a mandatory source of information, and s-trace always calls s-follow with extra-verbose options.
This output file is called <dirname>.tmp, where <dirname> is the name of the results directory (for example, test-run.023 will have a results-directory called test-run.023.res and the verbose file will be called test-run.023.res.tmp within that same directory.
Note that, by virtue of this "blessing" of a temporary file as real data file, a results directory cannot be renamed without requiring to re-run the analysis. This is definitely a bug, but not very high priority.
s-follow reads input information from stdin, a line at a time. Each input frame is represented as a frame indicator (a line made up of a single integer number) and zero or more region descriptors (lines made up of four integer numbers: X and Y of the center, width and height of the region). An empty line is used to separate each frame from the next one.
The results file is laid out in this way:
   1.4881   11.3865   6.27095    15        71 - 172 108
  1.99994   13.1405   2.67821    17        50 - 329   4
  9.92373   15.7351   3.64126    18        12 - 201 155
  8.44712   15.0731   3.47548    18        32 -  66 224
The fields are, in order: speed-if-straight, average-speed, length-of-cell, number-of-steps, first-frame, first-x, first-y.
The "temporary" results file, is almost-free-format for historical reasons, although nowadays s-results is forced to parse it. The reader who want to know about this format is urged to take a look at one such files, as they are pretty self-explanatory.
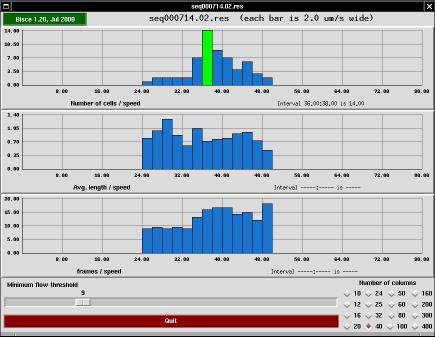
The s-results program is a user interface meant to help checking the results of an image tracking session. The tool performs two tasks: it draws diagrams and it allows the user to discard individual paths (redrawing the diagrams accordingly).
The top bar in the main window of s-trace shows the program's version and the name of the results directory being displayed. If you click on the version string, a copy of tkinfo is spawned to show this very documentation.
The window's main part consists of three histograms sharing the same X axis. The abscissa represents cell speed (in micrometers per second) and the ordinate represents the number of cells that travel at that speed, the average length of those cells (expressed as micrometers) and the average number of frames that constitute the paths represented by that column.
Each histogram is drawn into a grid of 10x4 cells, and the actual values written on the grid are automatically generated to fall on even values.
At the bottom of the window there are two control tools: an horizontal slider that allows discarding paths if they are too short and a grid of buttons to change the number of columns that make up the histogram.
By acting on the slider, the user can discard all the cells whose path is shorter than the specified value. The histograms are automatically redrawn whenever the slider is moved. Please note that the scaling on the Y axis can change as the histogram changes, because the program recalculates the optimum Y scaling each time the histogram is redrawn. X scaling, on the other hand, is not modified and is common to all histograms. It may happen that the right part of the histograms looks empty, but this only happens when there are short-path items that would be displayed there when the user selects a smaller path threshold.
Using the grid of buttons, the user can change the number of columns that are drawn in the histogram windows. The optimal number varies according to the number of cells that are present in the individual acquisition, as well as on the horizontal scaling that is chosen by the program. The height of each histogram bar (expressed in micrometers/second) is always displayed in the top bar as well.
When the mouse pointer is moved over the histogram, the program highlights the bar where the mouse is sitting and prints detailed information about X and Y values of that bar. Such information is printed to the bottom-left of each histogram.
In a typical experiment, automatic image tracking may consider good some cells or path that are not good enough. To this aim, the user of s-results is allowed to remove individual items from the data set used to draw the diagrams. When the user clicks on one of the histogram bars (in any of the three histograms), a selector window is drawn on the screen in order to allow individual selection of cells/paths.
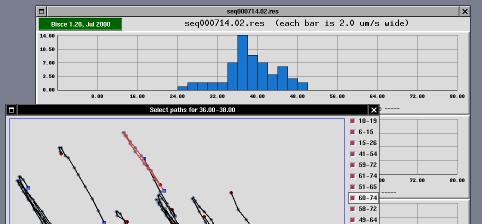
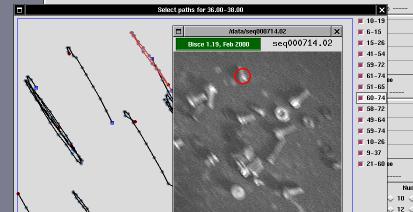
The selector window is a tool that can be used to enable/disable use of individual paths in histogram creation.
The window represents the acquired area enlarged by 2 or by 4 (default is 2). An "enlarge" button can be used to go to 4X visualization, and a "reduce" button can be used to go back to 2X visualization. Scrollbars are drawn whenever the window is smaller than the acquisition area (the window is always smaller than the screen to avoid problems in the user interface).
The window includes drawings associated to each path that the s-trace and s-follow found and that histogram creation associated to the "current" histogram column (i.e., the one being clicked to open the selector window).
Each path is represented as a black line; each cell position during the path is identified by a gray spot; the "head" of the path is identified by a blue square and the tail is identified by a dark-red spot.
To the left of the acquisition area, there are one or more columns of check-buttons. Each button is associated to one of the paths, and its label represents the first and last frame where the path has been tracked. For example, a label of "22-48" means that the corresponding path started at frame number 22 and ended at frame number 48. The first frame of each sequence is numbered as frame zero.
When the user drags the mouse over either a check-button or a path, both the check-button and the path are highlighted, so you can easily associate each check-button to its path.
Whenever a check-button is de-selected, the corresponding path is removed from the active data-set, whenever a check-button is selected, the corresponding path is considered part of the the active data-set.
When the "Ok" button is pressed, the selector disappears from the screen and the histograms are redrawn according to the new data-set. To avoid wasting system resources, no redrawing is performed if the data-set has not been changed.
In order to ease selection of valid/invalid paths, the selector window operates in strict coordination with s-viewer.
Whenever the mouse is dragged over either a path or a check-button, s-viewer is fired (or just notified, if it is already running). If s-viewer is already running, but it is displaying a different acquisition, it will re-load the acquisition data where s-results is working. If s-viewer is displaying the gray-scale version associated to the current experiment, then it won't switch to the input images.
When the mouse is over a check-button or a path in the selector window
and s-viewer is displaying one of the frames that build the current
path, is-viewer will display a red ring around the center of the
cell whose path is under the mouse pointer. If s-viewer is playing
the acquired sequence, you'll be able to identify the path by looking at
the red ring.
In order to allow easier tracking of paths, the current version of s-results can also drive s-viewer forwards and backwards in the frame-set. Whenever the mouse pointer is over a check-button, the user can use the s-viewer control keys (a, s, d, f, g, h, j) in the same way as they work on s-viewer itself, the only difference being in the behaviour associated to the a key. Whereas a would rewind the film when used in s-viewer, the same command issued by s-results tells s-viewer to jump to the first frame where the current path appears.
Unfortunately, I've not (yet) been able to associate keyboard commands to the paths. Such commands only work when the mouse pointer is over one of the check-buttons, and not when the pointer is over one path.
In order to accomplish its task, s-results builds some data files in the results directory. This document won't go into the details of such intermediate data files, but I think it's worth stating their role. While not all of these file are created by s-results, this is a description of the contents of a fully-populated results directory.
params
res.tmp
results
<dirname>.tmp
results.int
results.out